NicheMap Neighborhood Analysis Tutorial
This tutorial demonstrates the nichemap.neighborhood module for summarizing annotations and calculating cell-type composition around spatial structures across one or more graph-hop distances.
1. Imports
[1]:
from pathlib import Path
from IPython.display import Markdown, display
import os
import sys

sys.path.append(os.path.abspath("C://Users//heyi//Desktop/NicheMap"))

import scanpy as sc
import nichemap.neighborhood as nh
2. Load Data
[2]:
DATA_PATH = Path("../data/SSc_1_1_2_tutorial.h5ad")
OUTPUT_DIR = Path("./outputs/neighborhood")

OUTPUT_DIR.mkdir(parents=True, exist_ok=True)

adata = sc.read_h5ad(DATA_PATH)

adata
[2]:
AnnData object with n_obs × n_vars = 82224 × 541
    obs: 'x_centroid', 'y_centroid', 'cell_type', 'structure_label'
    var: 'gene_name', 'gene_id'
    uns: 'cell_type_colors', 'structure_label_colors'
    obsm: 'spatial'
3. Configure Analysis
TARGET_REGIONS to one or more spatial structures of interest, such as ["Airway_wall"] or ["Airway_wall", "Vessel"].HOPS can be a single integer, such as 5, or a list of neighborhood scales, such as [1, 2, 3, 5].TARGET_CELL_TYPES = None uses all cell types; provide a list if you only want to analyze selected cell types.[3]:
STRUCTURE_COL = "structure_label"
CELL_TYPE_COL = "cell_type"

TARGET_REGIONS = ["Airway_wall"]
HOPS = 5

# Use None for all cell types, or provide a selected list.
TARGET_CELL_TYPES = None

# Example targeted mode:
# TARGET_CELL_TYPES = [
#     "Fibroblast",
#     "Macrophage",
#     "T cell",
#     "B cell",
#     "Plasma",
#     "Myofibroblast",
#     "Monocyte",
# ]
4. Review Annotation Categories
display_annotation_summary summarizes the cell-type and structure columns, then renders a compact spatial overview colored by the structure column.
[4]:
annotation_summary = nh.display_annotation_summary(
    adata,
    cell_type_col=CELL_TYPE_COL,
    structure_col=STRUCTURE_COL,
)
Dataset annotation summary
Total cells: 82,224
Cell-type categories: 22
Spatial structure categories: 7
| count | percentage | |
|---|---|---|
| Secretory | 12,560 | 15.28% |
| Fibroblast | 11,912 | 14.49% |
| Macrophage | 11,376 | 13.84% |
| Endothelial | 11,158 | 13.57% |
| T cell | 6,771 | 8.23% |
| Basal | 4,380 | 5.33% |
| Ciliated | 4,275 | 5.20% |
| DC | 3,442 | 4.19% |
| B cell | 2,833 | 3.45% |
| Pericyte | 2,577 | 3.13% |
| Myofibroblast | 2,283 | 2.78% |
| SMC | 2,280 | 2.77% |
| Plasma | 2,166 | 2.63% |
| Monocyte | 1,982 | 2.41% |
| AT2 | 909 | 1.11% |
| Mast | 763 | 0.93% |
| Mesothelial | 235 | 0.29% |
| AT1 | 138 | 0.17% |
| Proliferating - Epi | 65 | 0.08% |
| NK | 42 | 0.05% |
| PNEC | 41 | 0.05% |
| Prolif_Imm | 36 | 0.04% |
| count | percentage | |
|---|---|---|
| Interstitial_2 | 29,867 | 36.32% |
| Airway_wall | 23,502 | 28.58% |
| Pleura | 8,556 | 10.41% |
| Interstitial_1 | 7,712 | 9.38% |
| Vessel | 6,515 | 7.92% |
| Airway_lumen | 3,073 | 3.74% |
| B_cell_follicle | 2,999 | 3.65% |

5. Run the Full Neighborhood Workflow
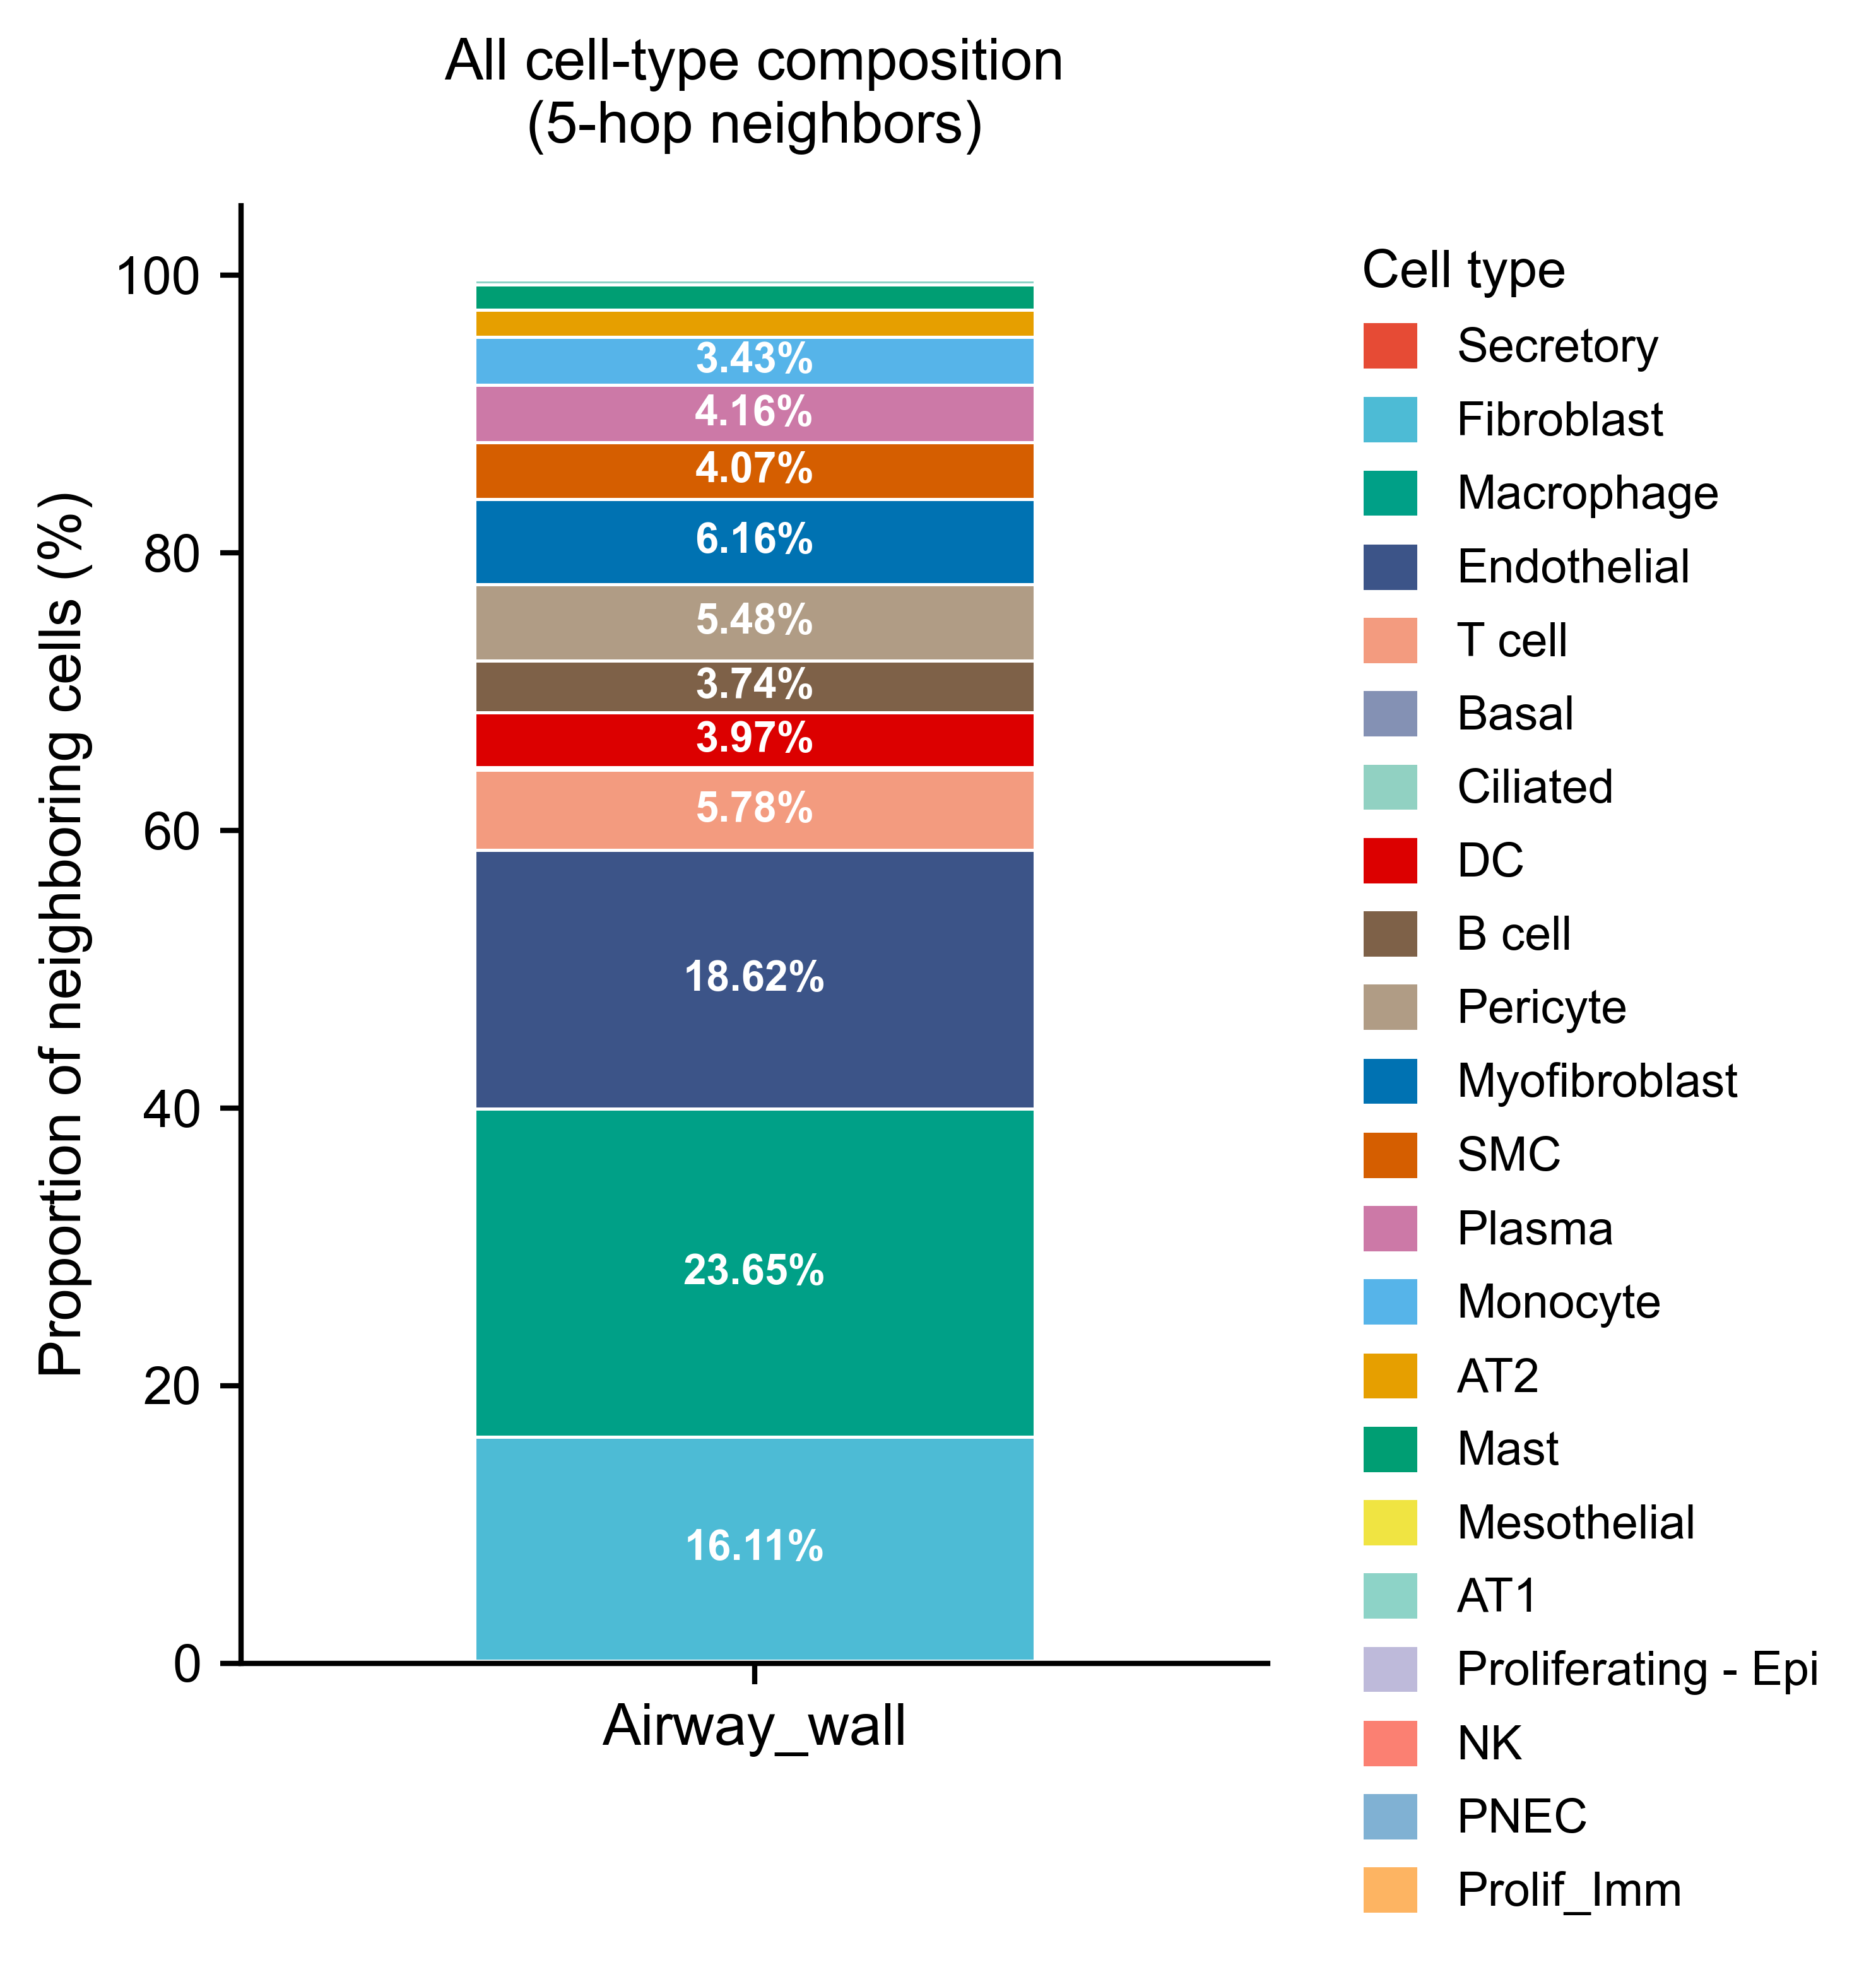
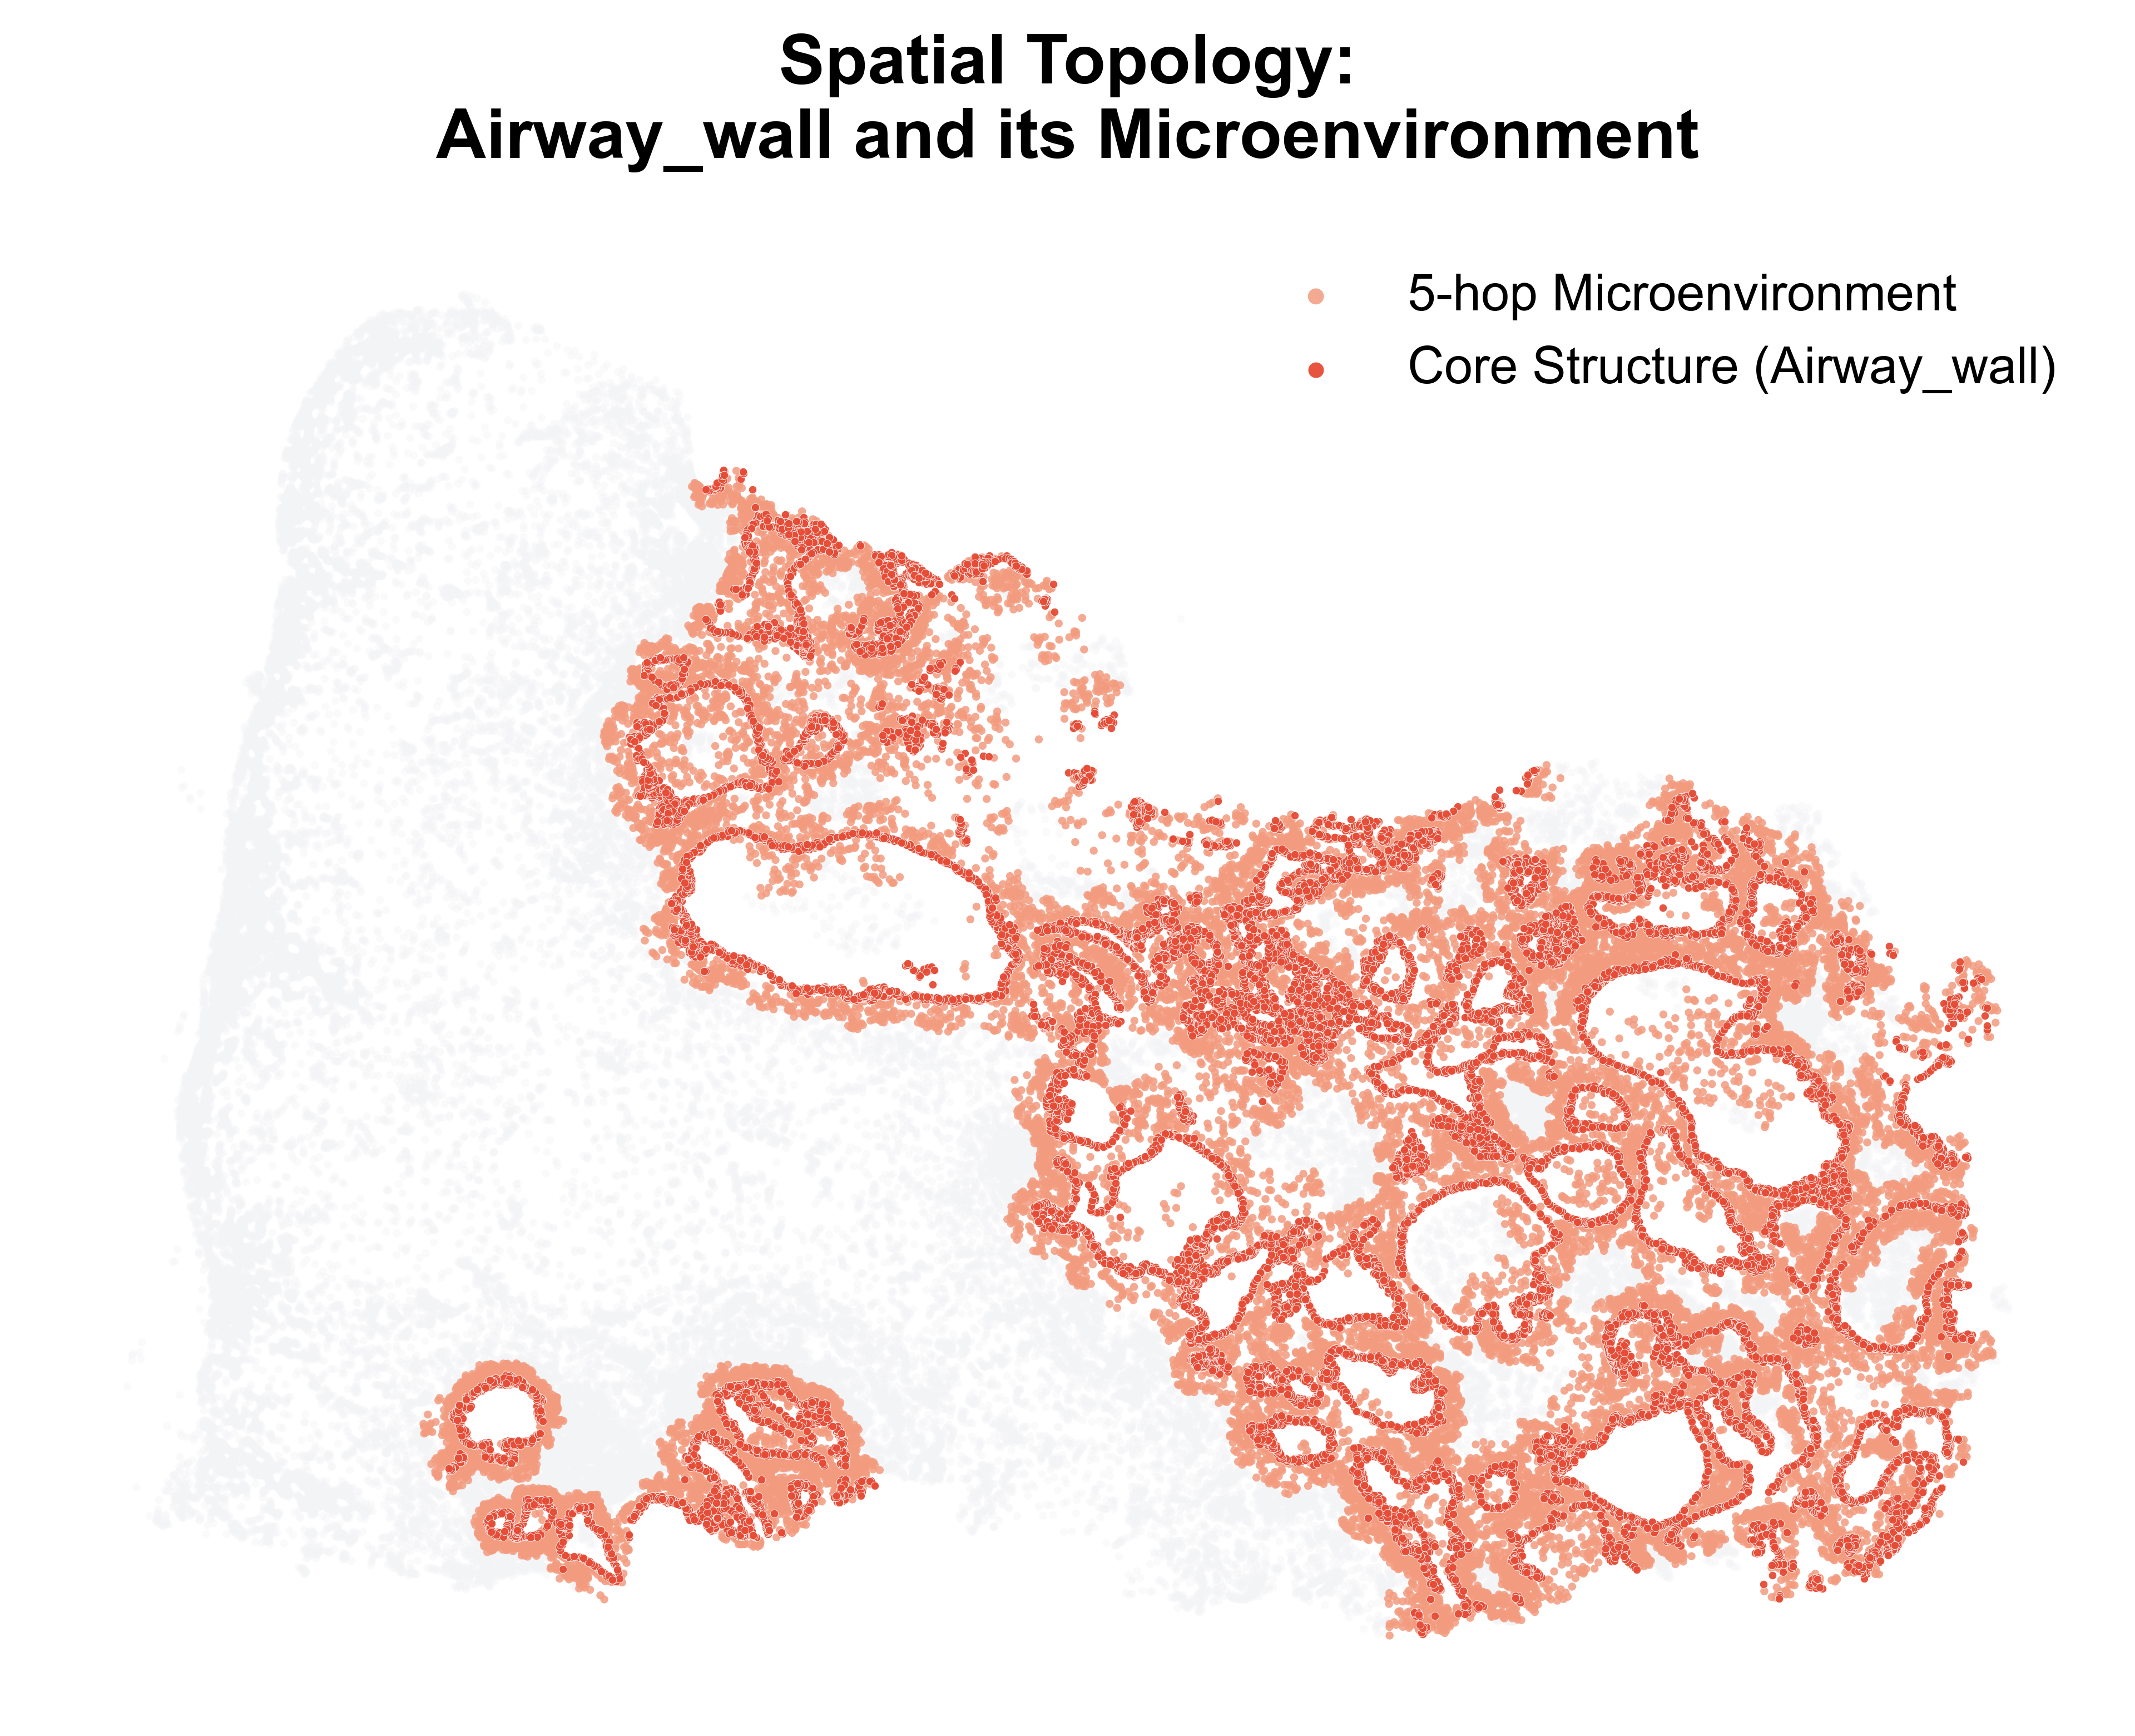
The high-level function calculates proportions, saves CSV files, and exports bar plots, spatial topology plots, and the hop-gradient trend plot when multiple hops are supplied.
[5]:
results = nh.run_cell_type_neighborhood_analysis(
    adata=adata,
    target_regions=TARGET_REGIONS,
    hops=HOPS,
    structure_col=STRUCTURE_COL,
    cell_type_col=CELL_TYPE_COL,
    output_dir=OUTPUT_DIR,
    selected_cell_types=TARGET_CELL_TYPES,
)
NicheMap v0.1.0
Spatial Niche and Neighborhood Analysis Toolkit
Cell Types → Structures → Spatial Niches
======================================================================

Dataset      : 82,224 cells × 541 genes
Structures   : ['Airway_wall']
Hops         : 5
Cell types   : All
----------------------------------------------------------------------
>>> 1. Building spatial adjacency matrix...
Spatial adjacency matrix is ready. Time used: 44.23 seconds
[6]:
display(Markdown("### Generated outputs"))

for p in results["csv_paths"]:
    display(Markdown(f"- 📄 `{p}`"))

for p in results["figure_paths"]:
    display(Markdown(f"- 🖼️ `{p}`"))
Generated outputs
📄
outputs\neighborhood\All_CellType_Proportions_5hop.csv
🖼️
outputs\neighborhood\Barplot_All_Microenvironment_5hop.png
🖼️
outputs\neighborhood\Spatial_Topology_Airway_wall_Microenvironment_5hop.png
[ ]: